Subplots examples#
In Matplotlib, ax represents an individual subplot or axis in a figure. When working with multiple subplots, you can use the ax argument in the draw_annotation function to specify which subplot you want to annotate. If you do not specify the ax argument, it implies that you are working with a single plot rather than a set of subplots. In such cases, the annotations apply to the only existing plot in the figure.
import starbars
import matplotlib.pyplot as plt
# Example data for different subplots
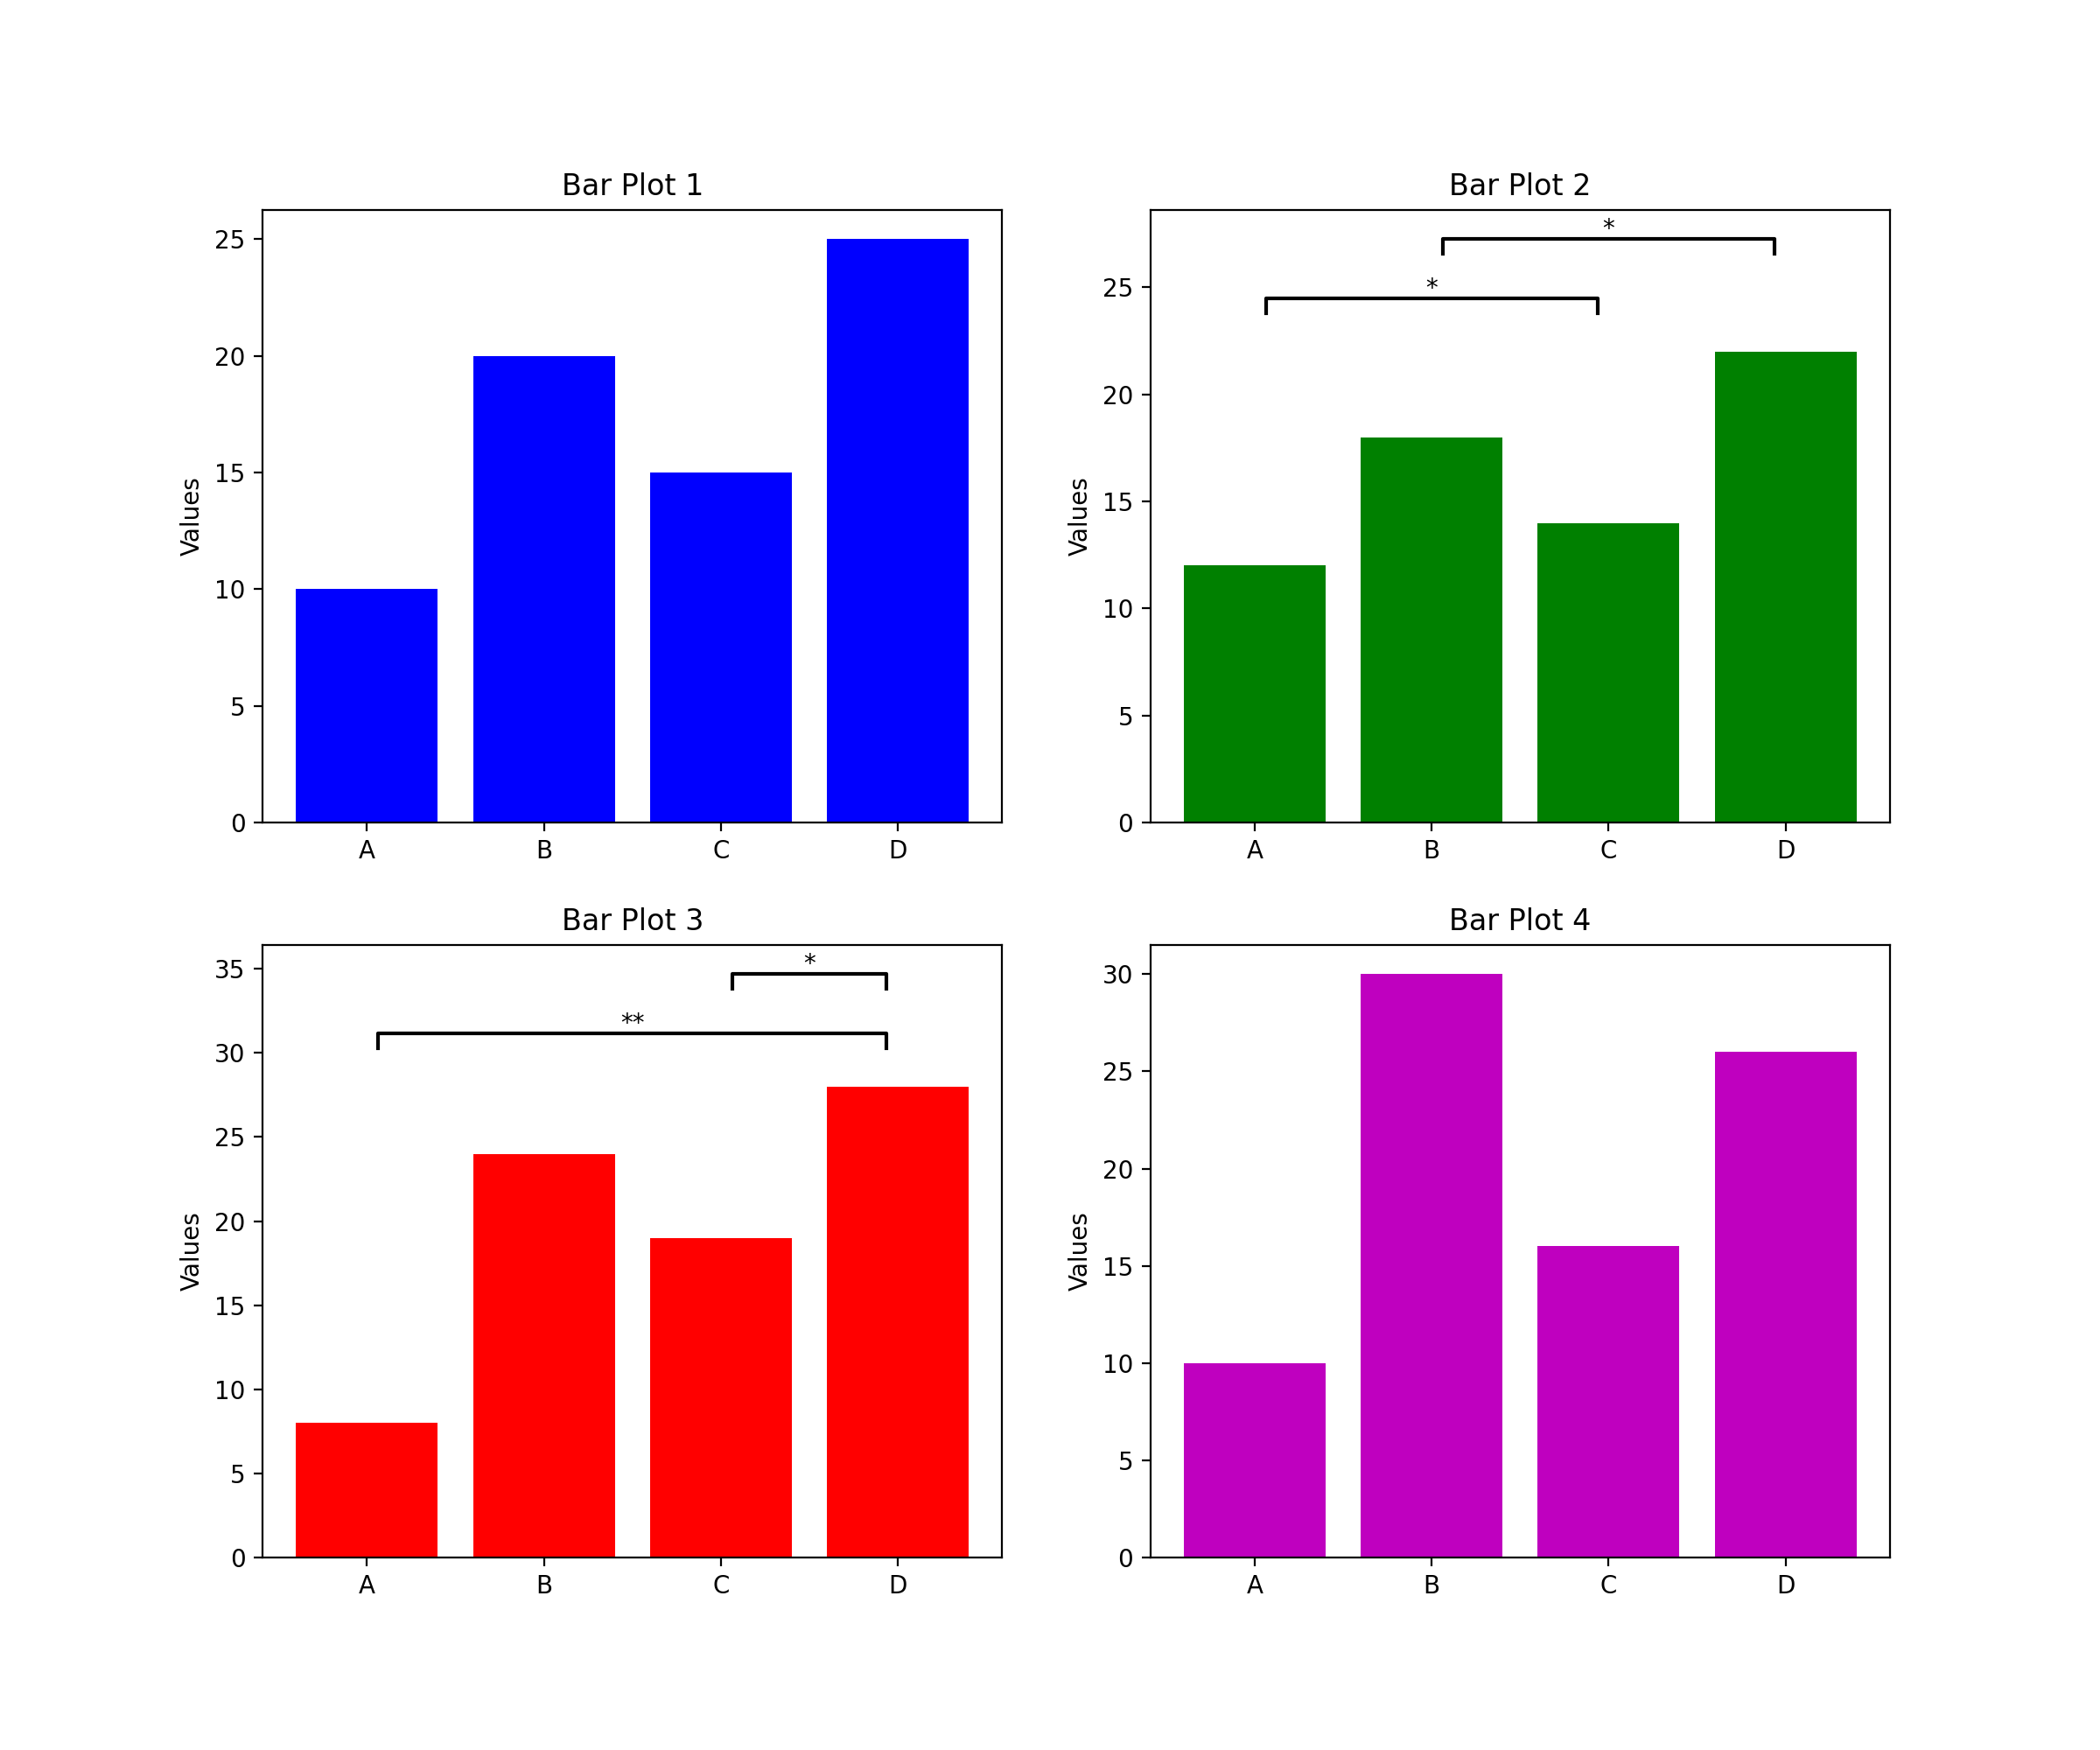
categories = ['A', 'B', 'C', 'D']
values1 = [10, 20, 15, 25]
values2 = [12, 18, 14, 22]
values3 = [8, 24, 19, 28]
values4 = [10, 30, 16, 26]
# Bar subplots
fig, axs = plt.subplots(2, 2, figsize=(12, 10))
axs[0, 0].bar(categories, values1, color='b')
axs[0, 0].set_title('Bar Plot 1')
axs[0, 0].set_ylabel('Values')
axs[0, 1].bar(categories, values2, color='g')
axs[0, 1].set_title('Bar Plot 2')
axs[0, 1].set_ylabel('Values')
axs[1, 0].bar(categories, values3, color='r')
axs[1, 0].set_title('Bar Plot 3')
axs[1, 0].set_ylabel('Values')
axs[1, 1].bar(categories, values4, color='m')
axs[1, 1].set_title('Bar Plot 4')
axs[1, 1].set_ylabel('Values')
# Draw annotations
annotations = [(0, 2, 0.05), (1, 3, 0.05)]
starbars.draw_annotation(annotations, ax=axs[0, 1])
annotations = [('A', 'D', 0.01), ('C', 'D', 0.03)]
starbars.draw_annotation(annotations, ax=axs[1, 0])
plt.show()
(Source code, png, hires.png, pdf)
