Basic examples#
These are examples for the most simple case uses.
import starbars
import matplotlib.pyplot as plt
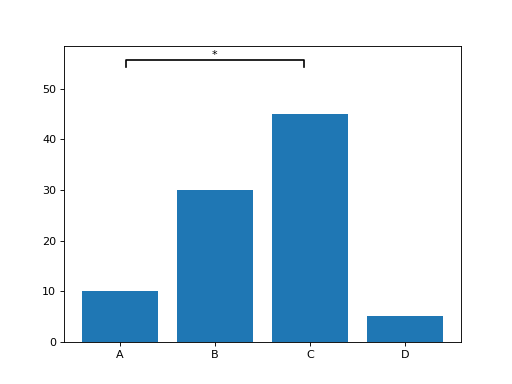
# Example data with labels and ns_show=False
categories = ["A", "B", "C", "D"]
values = [10, 30, 45, 5]
plt.bar(categories, values)
annotations = [("A", "B", 0.5), ("A", "C", 0.05)]
starbars.draw_annotation(annotations, ns_show=False)
plt.show()
(Source code, png, hires.png, pdf)

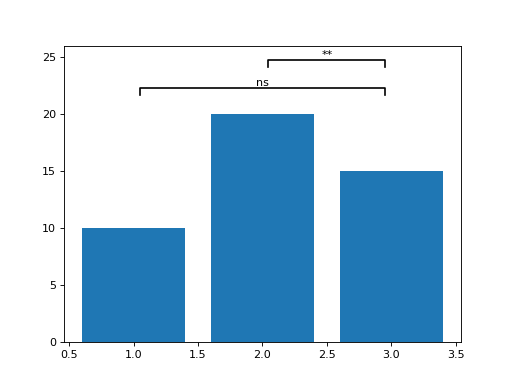
# Example data with numbers
categories = [1, 2, 3]
values = [10, 20, 15]
plt.bar(categories, values)

annotations = [(2, 3, 0.01), (3, 1, 0.5)]
starbars.draw_annotation(annotations)

plt.show()
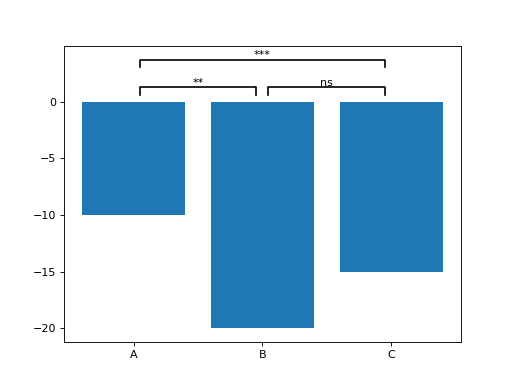
# Example data with negative numbers
categories = ["A", "B", "C"]
values = [-10, -20, -15]
annotations = [("A", "B", 0.01), ("B", "C", 0.5), ("A", "C", 0.0002)]

plt.bar(categories, values)

# Annotate significance
starbars.draw_annotation(annotations)
plt.show()
