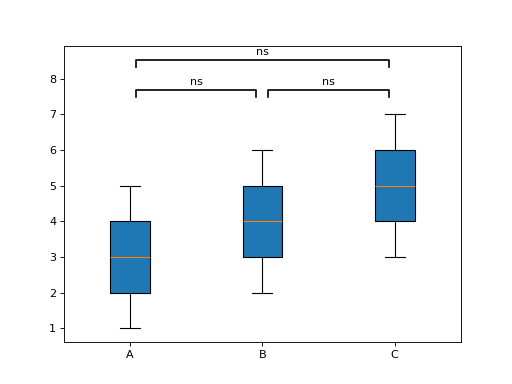
Boxplot with iteration#
Starbars only accepts already calculated p-values, but you can perform the preferred tests before it as an iteration over pairs of variables.
import starbars
import matplotlib.pyplot as plt
import scipy.stats as stats

# Example with iteration to find the p-value
values_dict = {"A": [1, 2, 3, 4, 5], "B": [2, 3, 4, 5, 6], "C": [3, 4, 5, 6, 7]}

annotations = []
keys = list(values_dict.keys())

# Perform t-test for each pair of variables
for i in range(len(keys)):
    for j in range(i + 1, len(keys)):
        key1 = keys[i]
        key2 = keys[j]
        values1 = values_dict[key1]
        values2 = values_dict[key2]

        t_stat, p_value = stats.ttest_ind(values1, values2)
        annotations.append((key1, key2, p_value))

values = [values_dict[key] for key in keys]

# Create boxplot
plt.boxplot(values, tick_labels=keys, patch_artist=True)
starbars.draw_annotation(annotations, text_distance=0.03)

plt.show()
(Source code, png, hires.png, pdf)